JOLTS Day Graphs: November 2018 Report Edition

Every month the U.S. Bureau of Labor Statistics releases data on hiring, firing, and other labor market flows from the Job Openings and Labor Turnover Survey, better known as JOLTS. Today, the BLS released the latest data for November 2018. This report doesn’t get as much attention as the monthly Employment Situation Report, but it contains useful information about the state of the U.S. labor market. Below are a few key graphs using data from the report.

1.

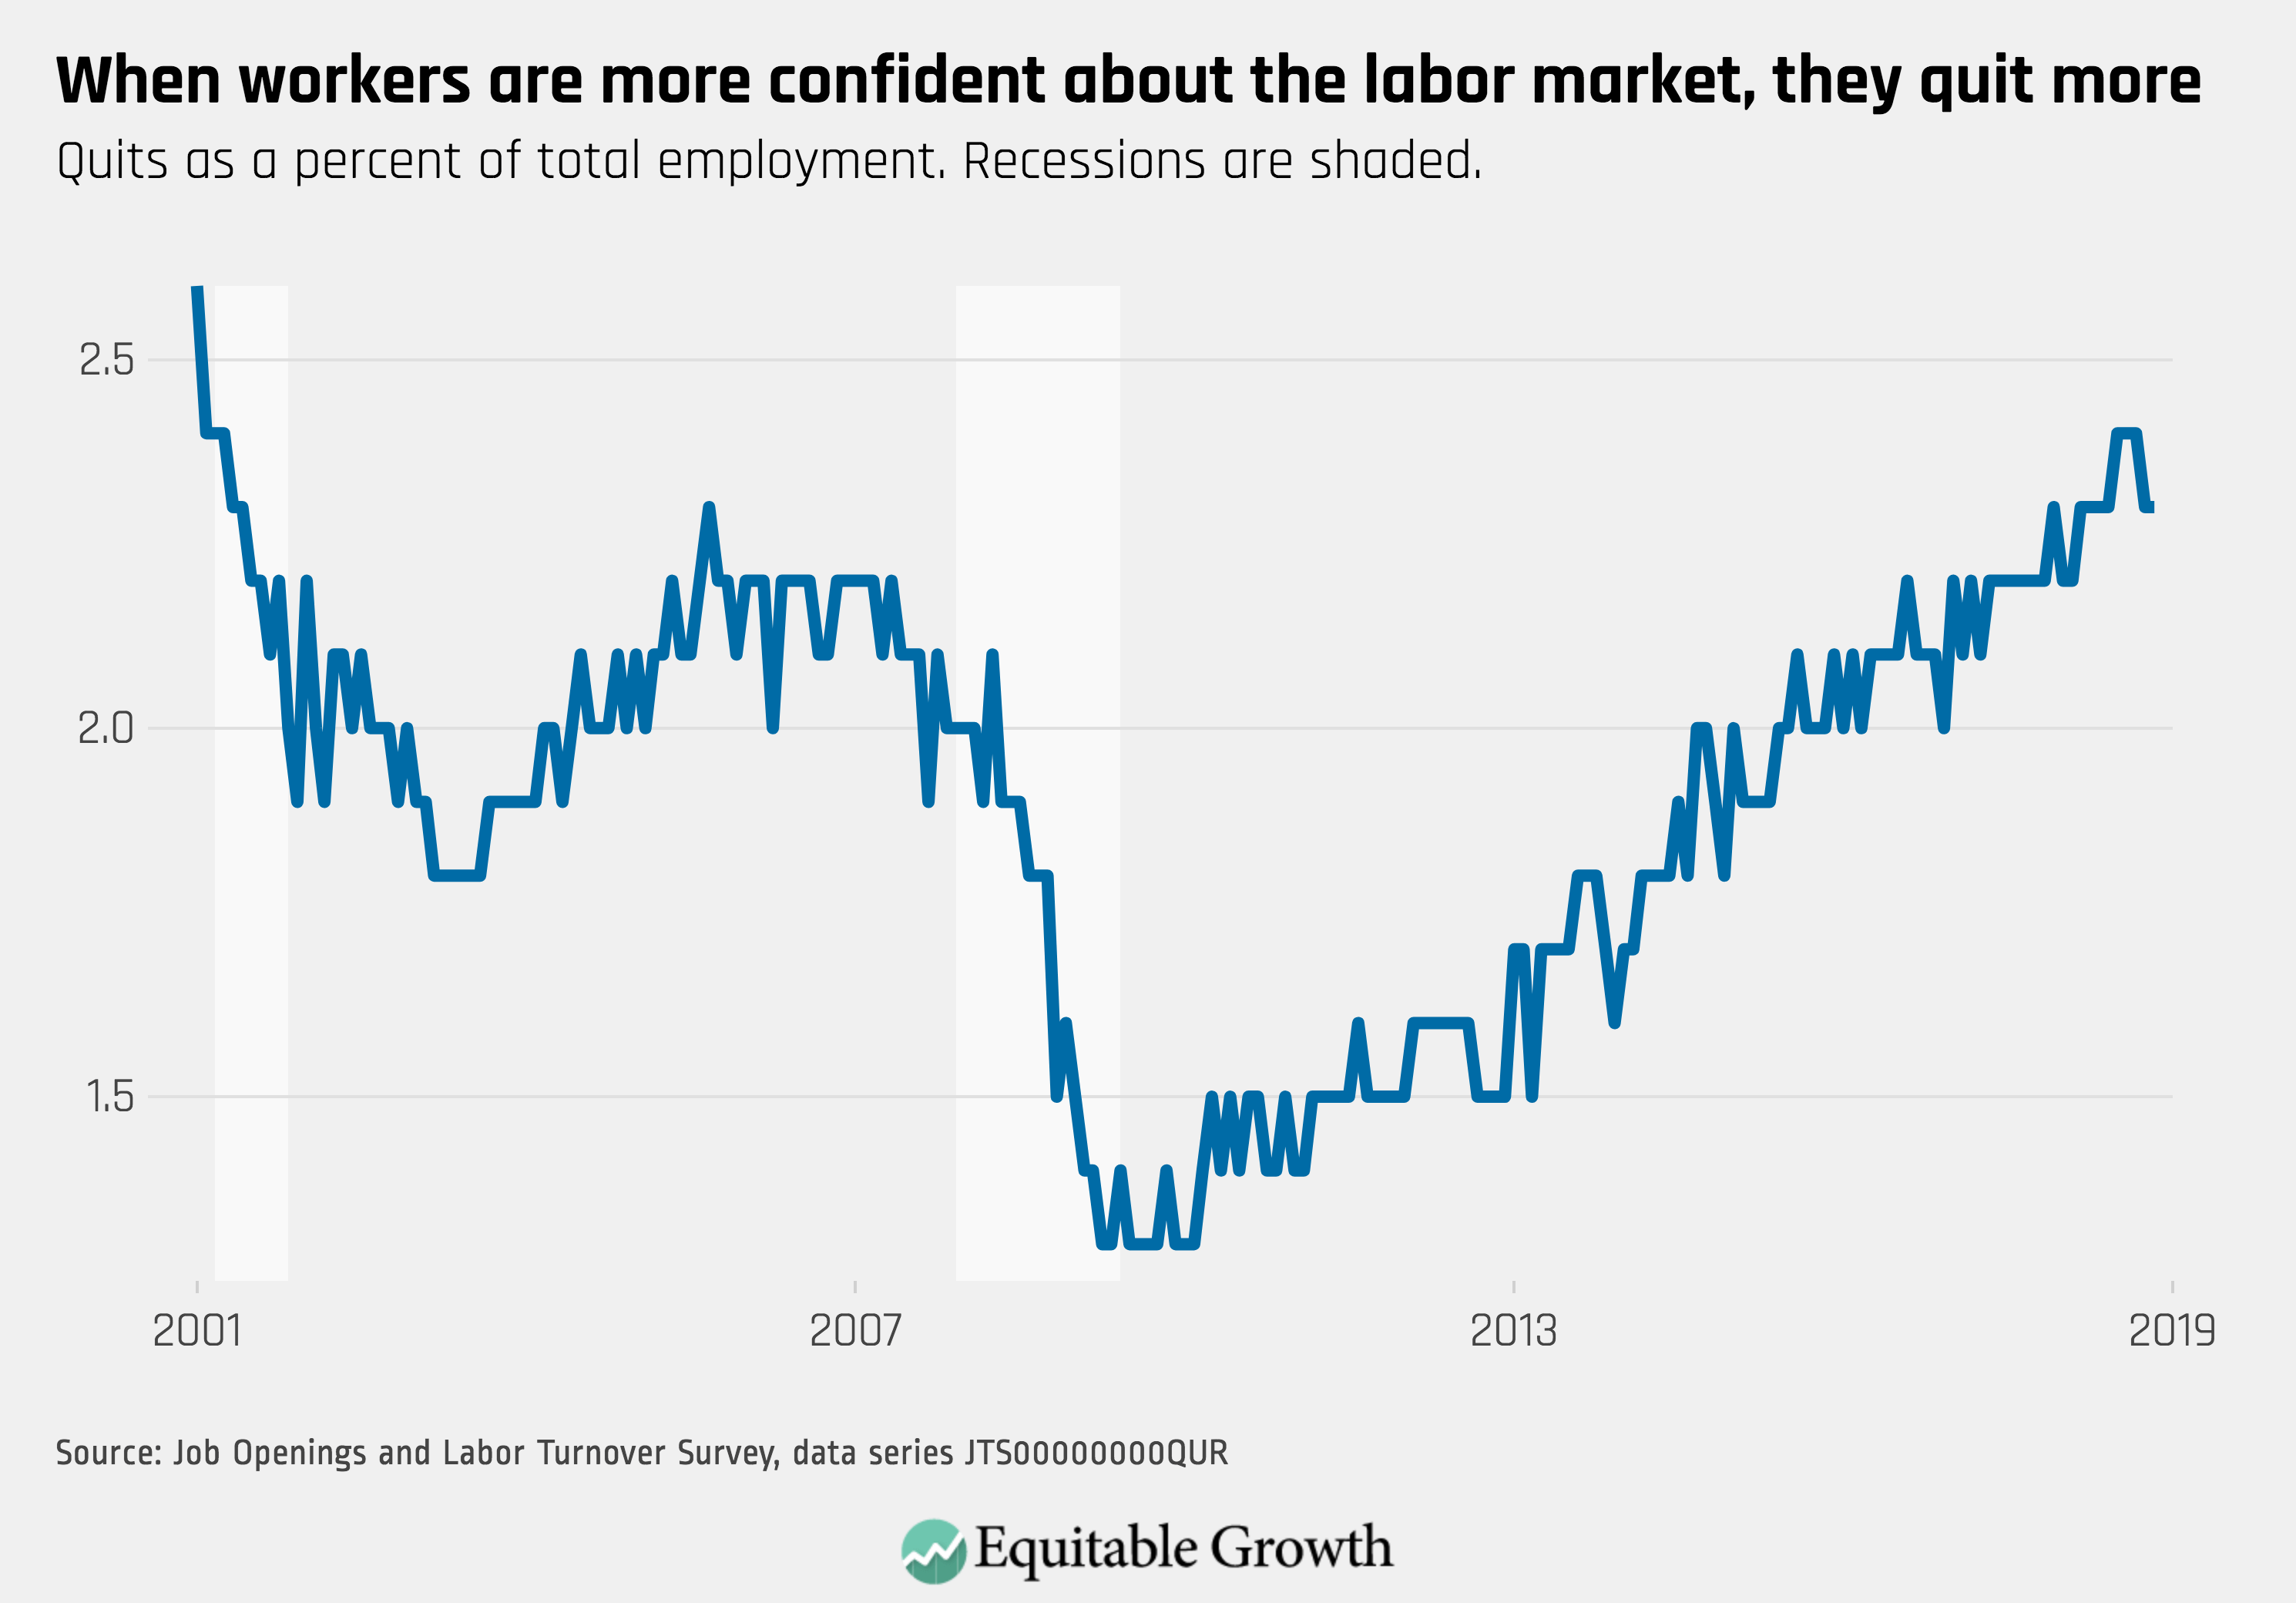
The quits rate held steady at a historically high level as the labor market continued to tighten.

2.

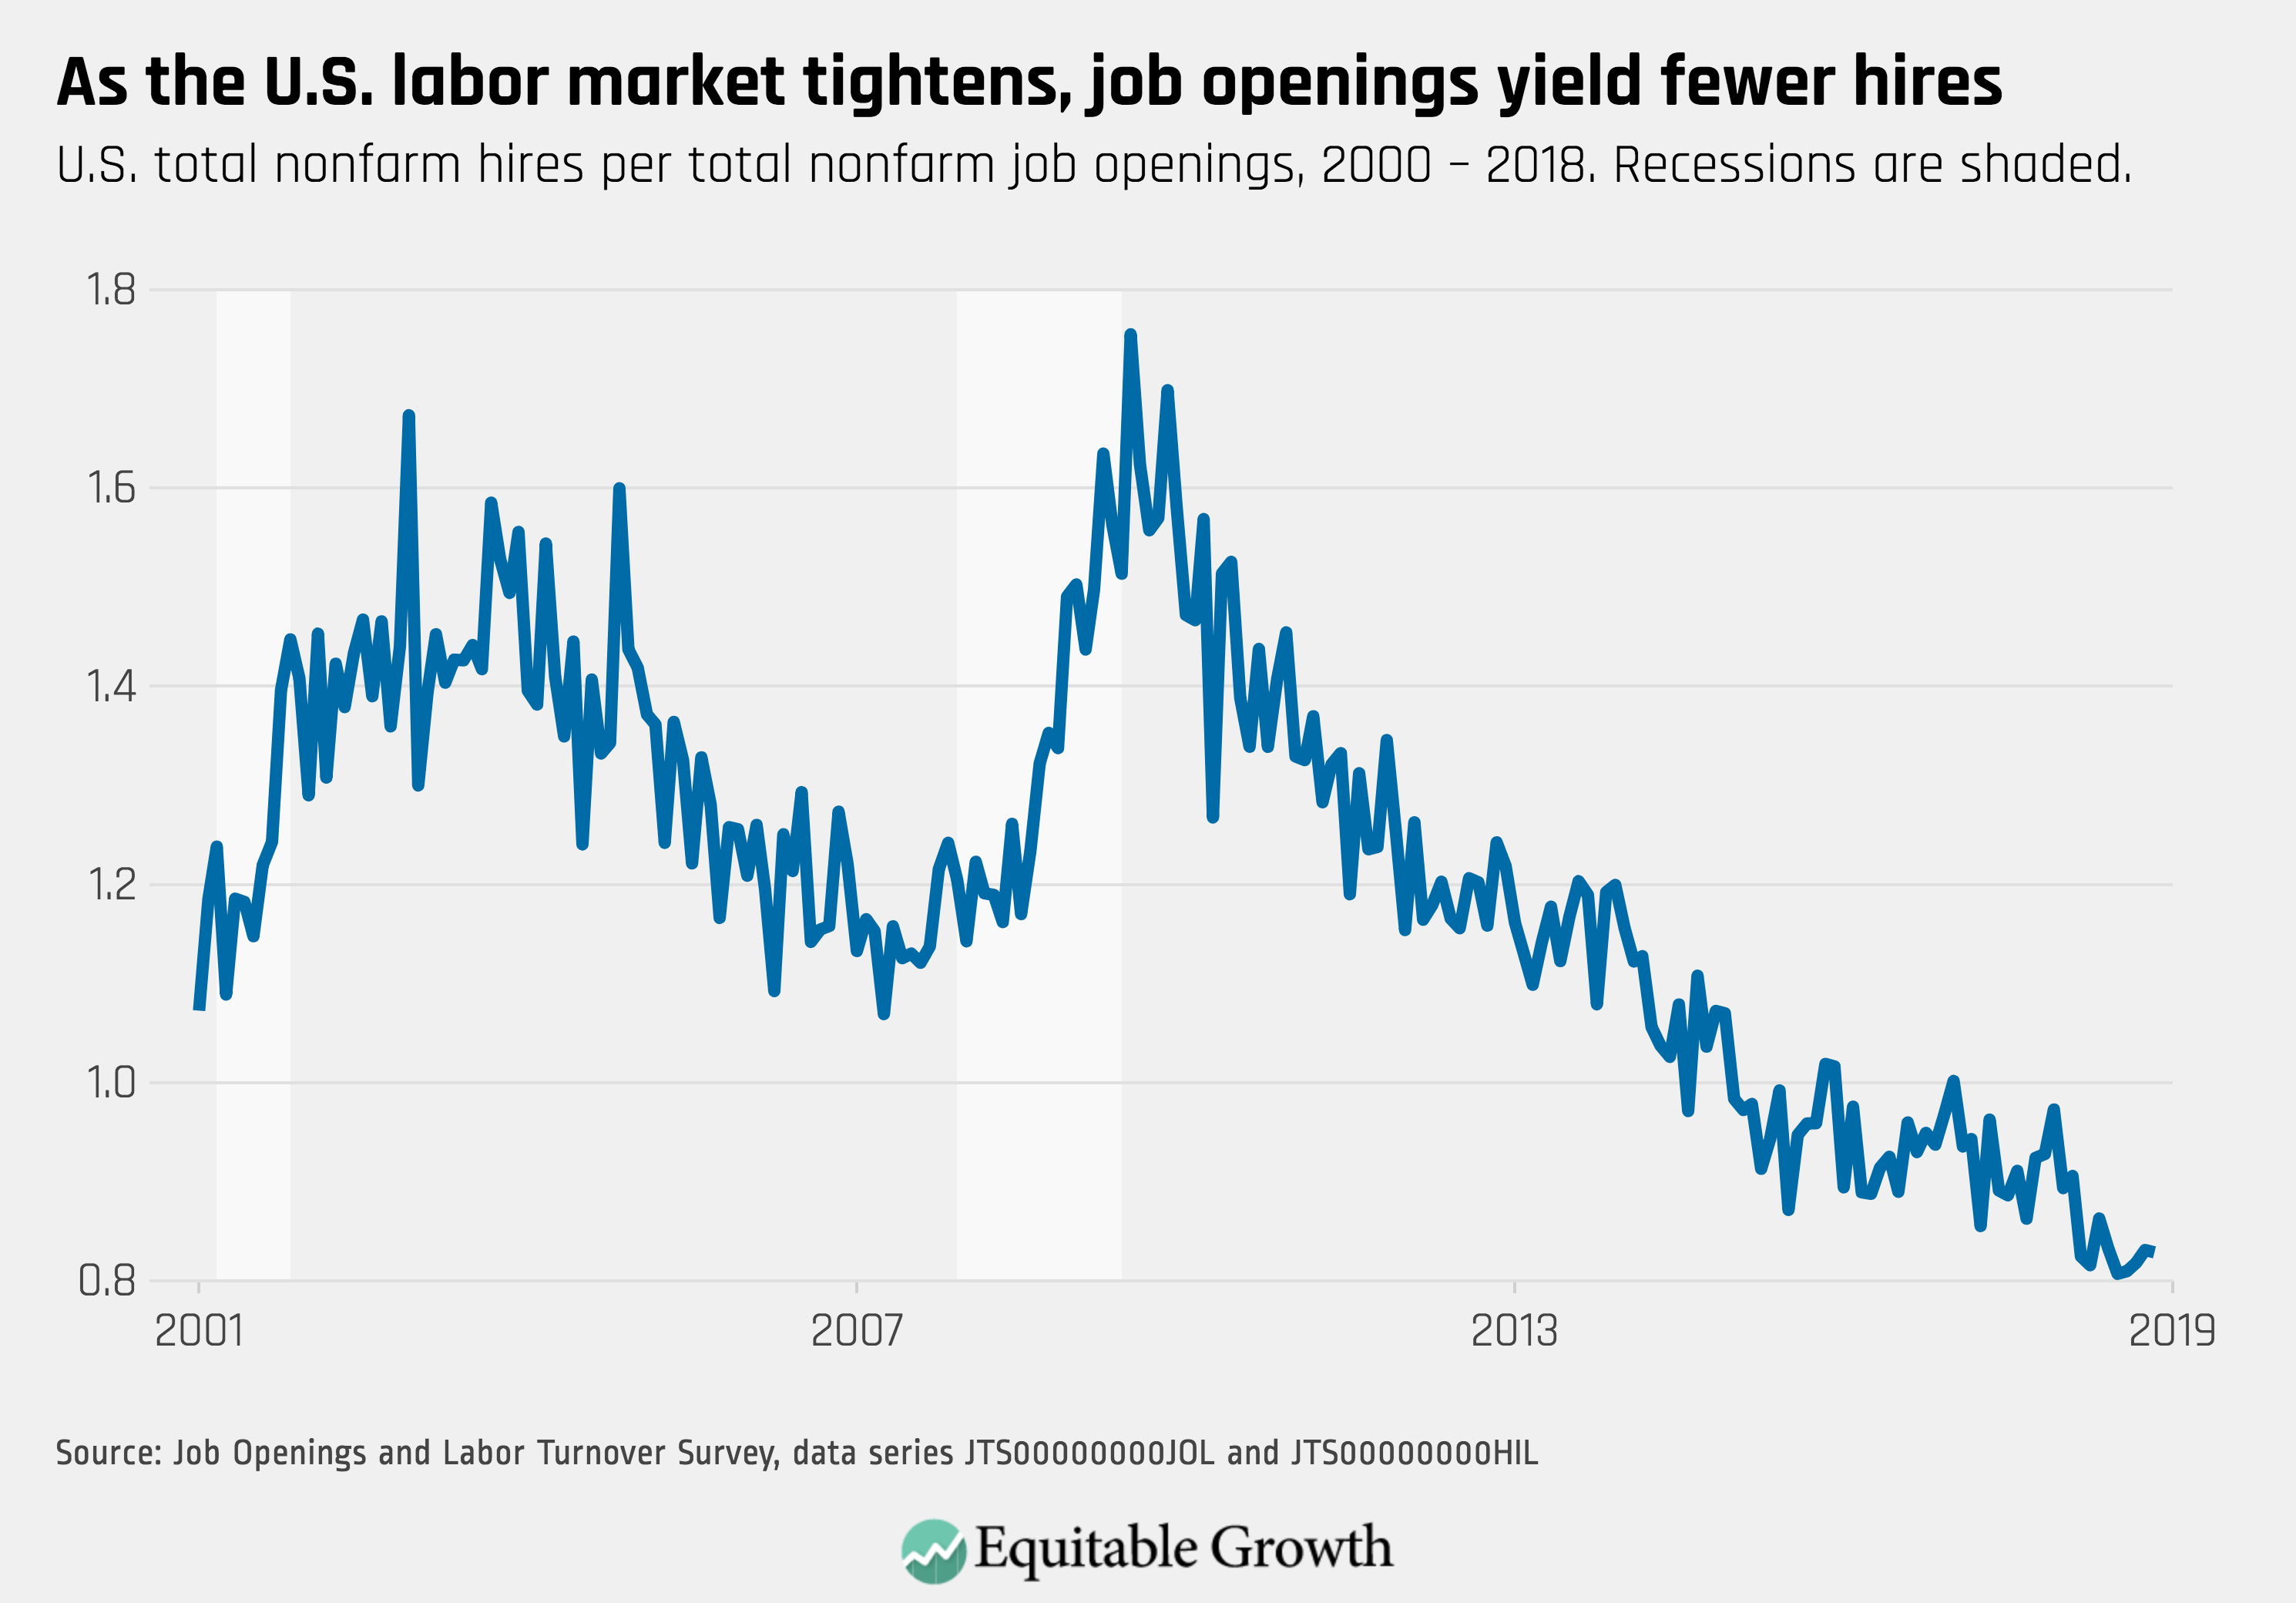
The vacancy yield continued its historic downward trend as job openings yielded fewer hires.

3.

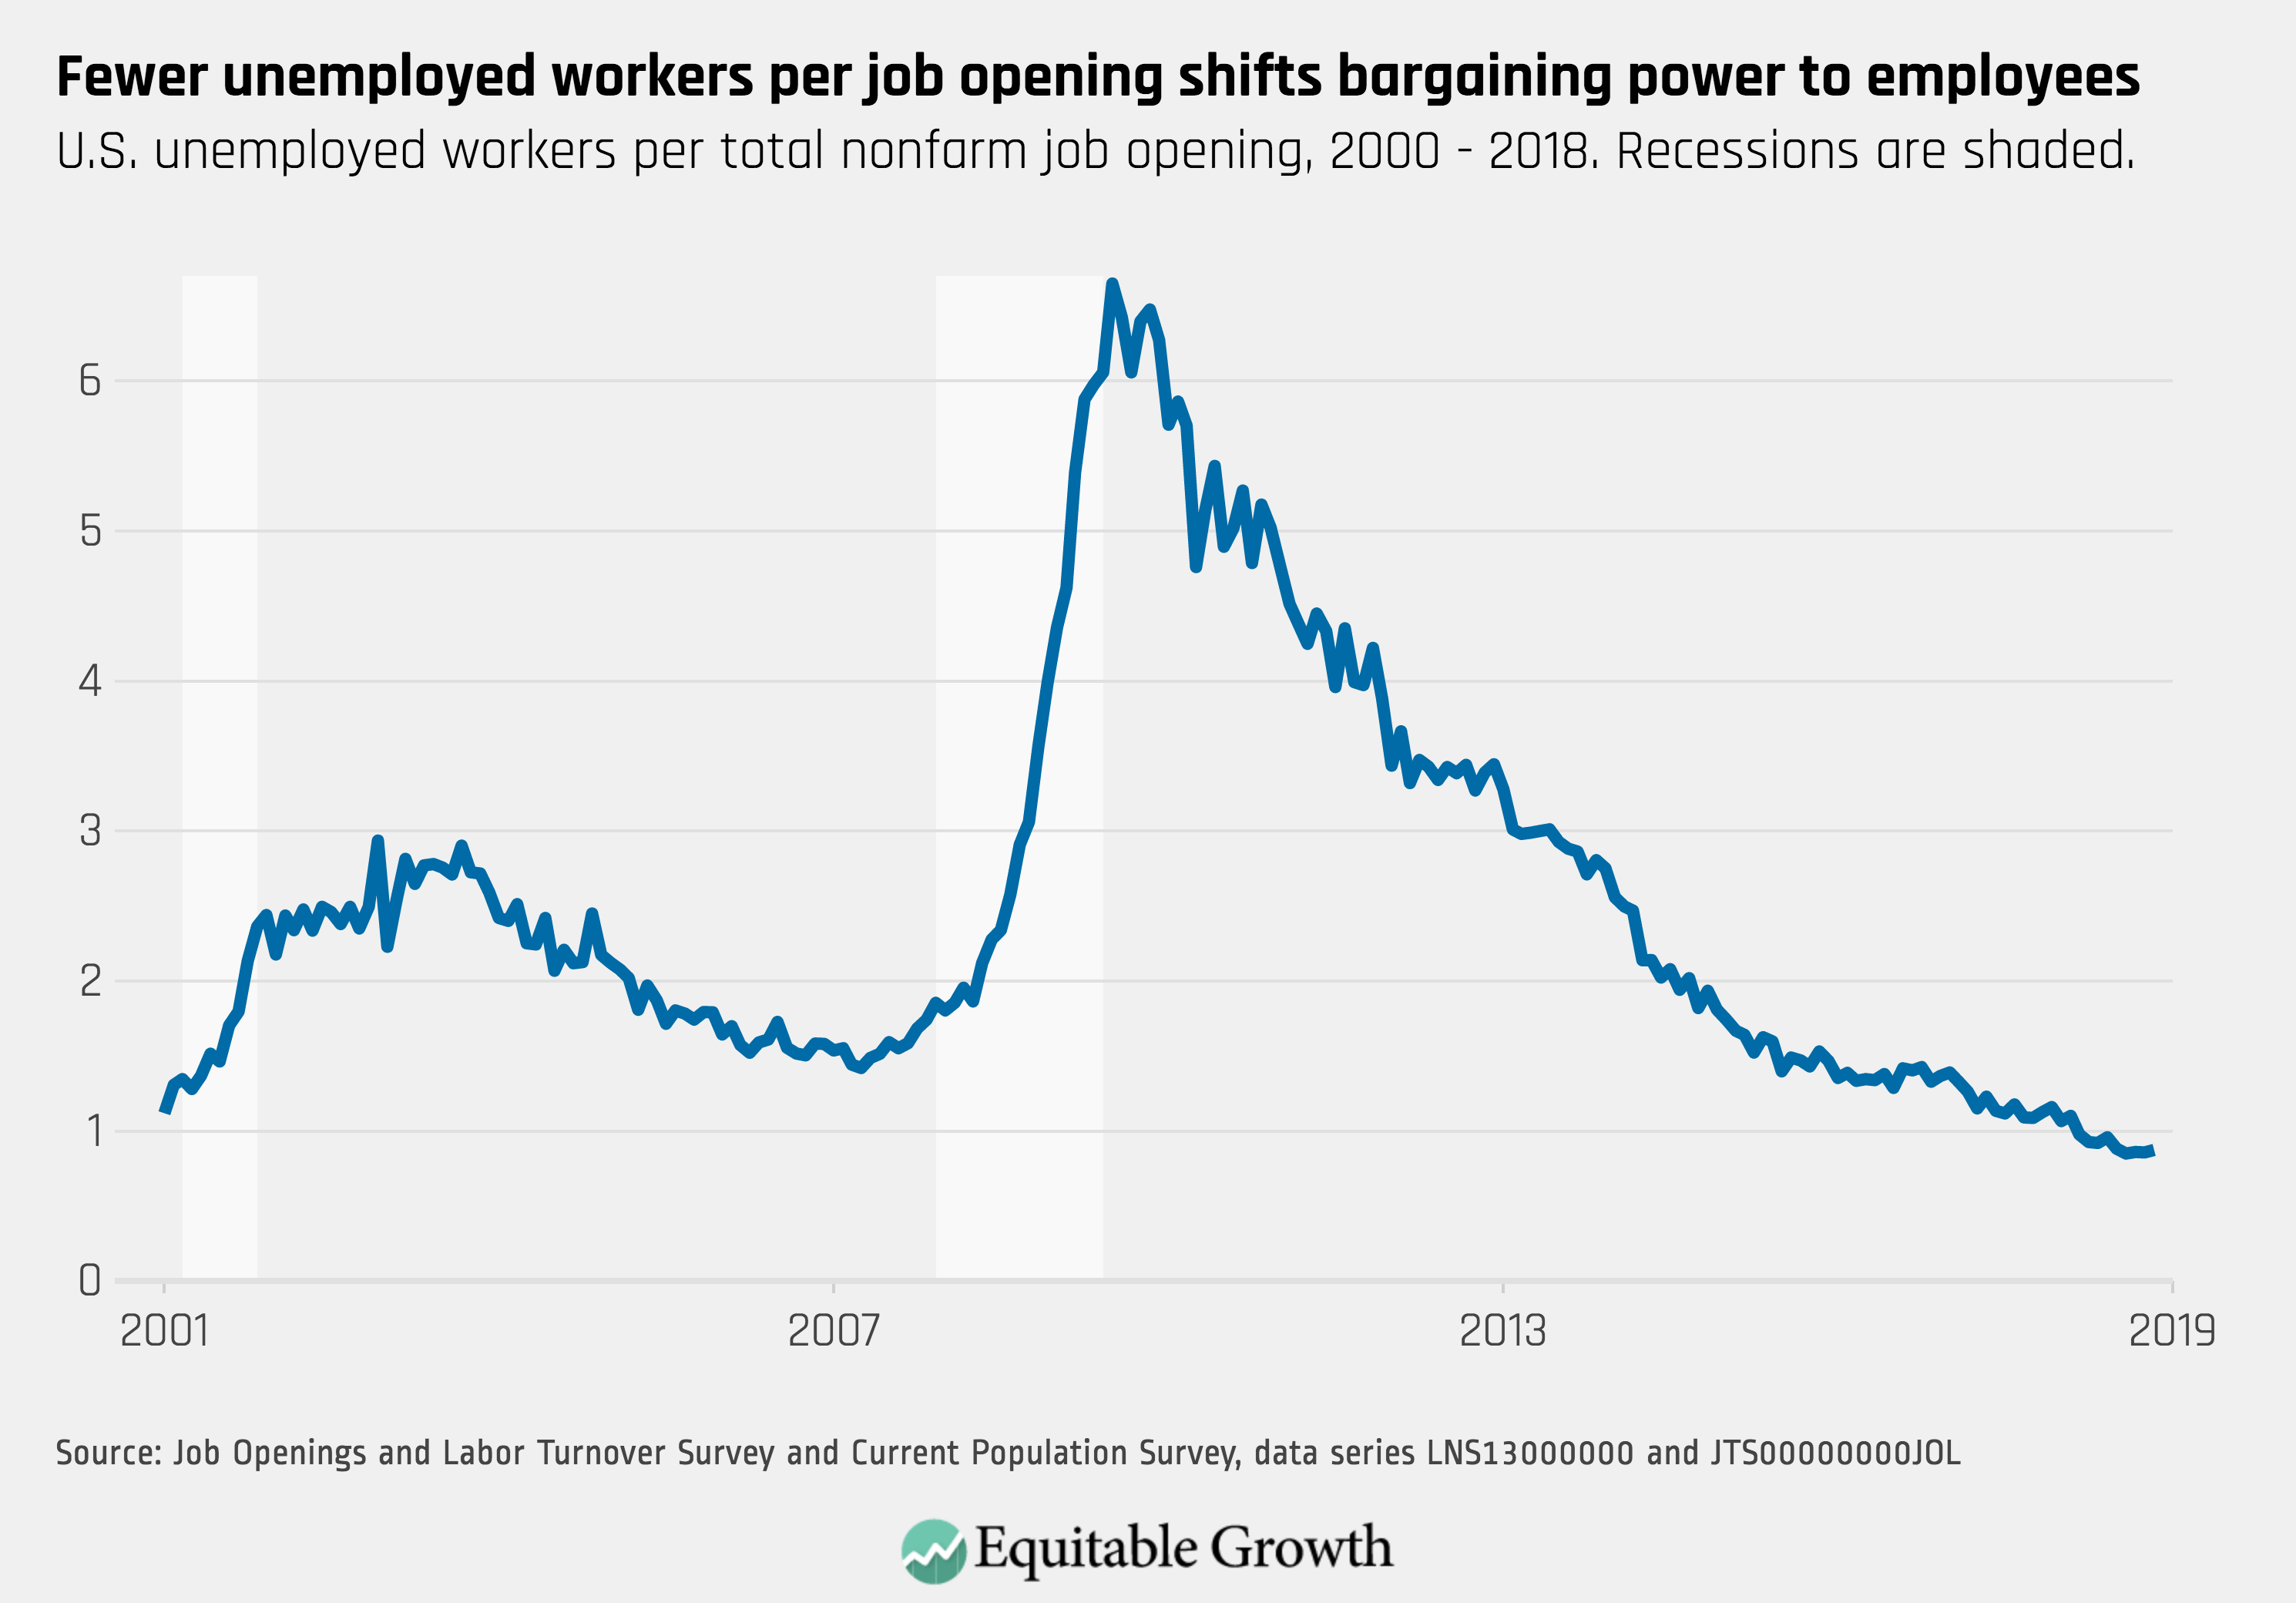
The unemployment-per-job openings ratio edged up slightly but is still at historically low levels with less than one unemployed worker per job opening.
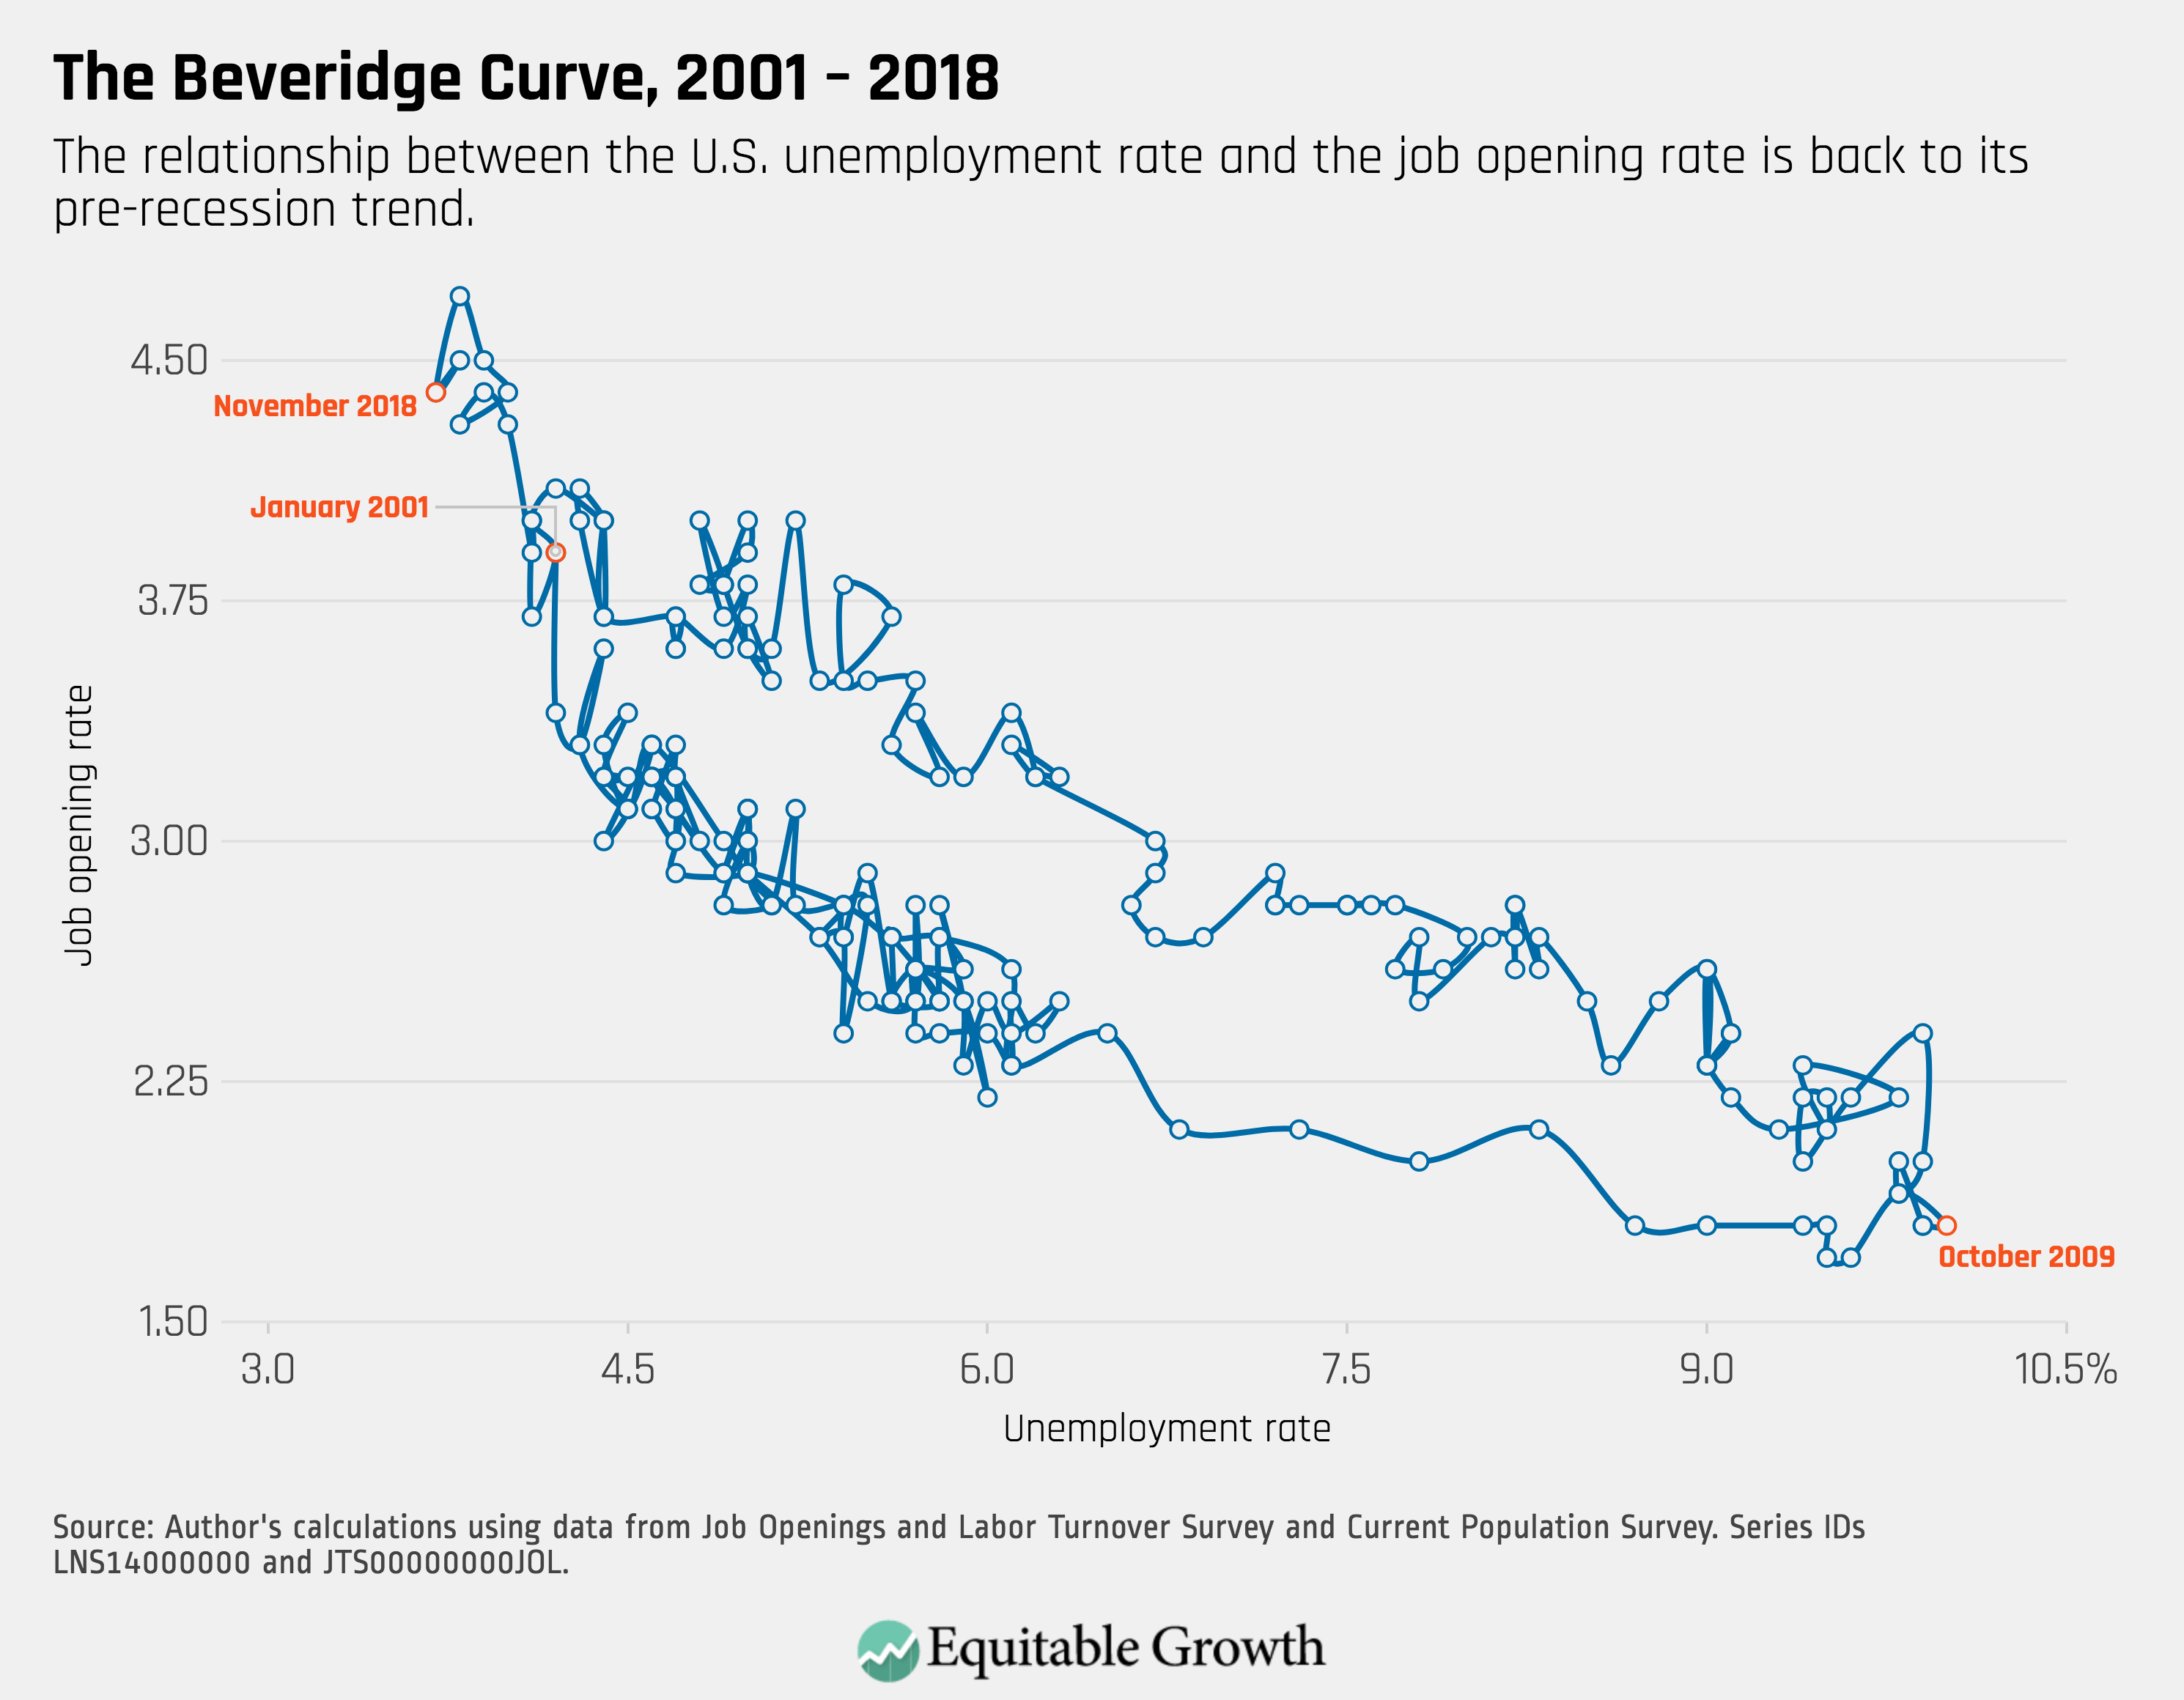
4.

The Beveridge Curve has changed little this past fall, with the labor market at pre-Recession levels.

January 8, 2019

Topics

Bargaining Power

Connect with us!

Explore the Equitable Growth network of experts around the country and get answers to today's most pressing questions!

Get in Touch